How Much Do Recommender Systems Drive Polarization?
Published:
Polarization caused by social media is seen by many as an important societal problem, which also overlaps with AI alignment (since social media recommendations come from ML algorithms). I have personally begun directing some of my research to recommender alignment, which has gotten me curious about the extent to which polarization is actually driven by social media. This blog post is the first in a series that summarizes my current take-aways. I’ll start (in this post) by looking at aggregate trends in polarization, then connect them with micro-level data on Facebook feeds in later posts.
I started out feeling that most polarization probably comes from social media. As I read more, my views have shifted: I think there’s pretty good evidence that other sources, including cable news, have historically driven a lot of polarization (see DellaVigna and Kaplan (2006) and Martin and Yurukoglu (2017)), and that we would be highly polarized even without social media. In addition, most readers of this post (and myself) are “extremely online”, and probably intuitively overestimate the impact of social media on a typical American. However, it is possible that social media has further accelerated polarization to an important degree, but the data are too noisy to provide strong evidence either way.
As a final caveat, I am considering polarization specifically, and ignoring other issues such as fake news, which could also be important. That being said, here are some key conclusion in more detail:
Social media seems unlikely to be the major direct cause of increased polarization. The main evidence is that polarization since 2000 has only increased in some Western countries, despite relatively uniform uptake of internet use across countries. Some additional weaker evidence is that polarization in the U.S. has increased steadily since 1980 (so pre-internet) and increased the most in the 65+ age group (which has the least social media usage).
However, there are two counterarguments to consider. The first is that traditional polarization measures might not make sense in multi-party systems (which includes many European countries such as Germany and Italy), and that other correlates of polarization, such as the rise of populism, do seem more universal.
The second counterargument is that, while social media might not directly influence 65-year-olds much, there could be important indirect effects if social media changes the incentives of traditional media companies.
Consequently, it is possible that social media is an important accelerator of polarization, due to these incentive effects or for some other reason. I did not find strong evidence either for or against this, mainly due to lack of data.
Definitions
Researchers typically consider two types of polarization: affective polarization, which has to do with feelings toward the opposing party, and issue polarization, which has to do with concrete political stances. Affective polarization is measured by questions such as “How warmly do you feel towards…?” or “Would you feel okay with your child dating a {Democrat, Republican}?”. In contrast, issue polarization is higher if opinions on e.g. guns, abortion, and taxes are all perfectly correlated with each other, and lower if they are only somewhat correlated.
Iyengar has an excellent survey on affective polarization, arguing that it is the more dangerous of the two for a healthy democracy. Unfortuantely, it has also increased significantly over time in the U.S., as we will see below. Most of the metrics below measure affective polarization, although some measure a combination of the two, and I won’t be too careful to distinguish (we’ll distinguish them more carefully in later posts).
Sources
To reach these conclusions, I primarily used the following sources:
- Social Media, News Consumption, and Polarization: Evidence from a Field Experiment (Levy, 2020)
- Cross-Country Trends in Affective Polarization (Boxell et al., 2020)
- Greater Internet use is not associated with faster growth in political polarization among US demographic groups (Boxell et al., 2017)
I also consulted these other sources:
- The Origins and Consequences of Affective Polarization in the United States (Iyengar et al., 2019), which among other things documents the case for affective polarization having important consequences (e.g. affecting job offers and dating).
- The Effect of Social Media on Elections: Evidence from the United States (Fujiwara et al. 2020), but I didn’t lean on this because its causal analysis relied on an instrument that I didn’t have enough intuition for.
- The Welfare Effects of Social Media (Allcott et al., 2019), but I didn’t lean on this because I was worried about sample size.
To What Extent Does Social Media Cause Polarization?
Social media seems unlikely to be the major direct cause of polarization, although it is possible that it has accelerated trends in polarization that already exist. The data do not say much either way regarding acceleration, due to finite-sample noise.
Not Likely the Major Cause
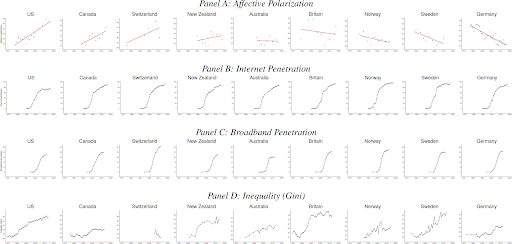
The first evidence against social media being the major direct cause of polarization are the cross-country trends in affective polarization from Boxell et al. (2020), shown below. Primarily the US, Canada, and UK show increasing polarization since 2000, while other countries show flat or decreasing trends. This is despite fairly similar trends in internet and broadband penetration across the 9 Western countries studied.
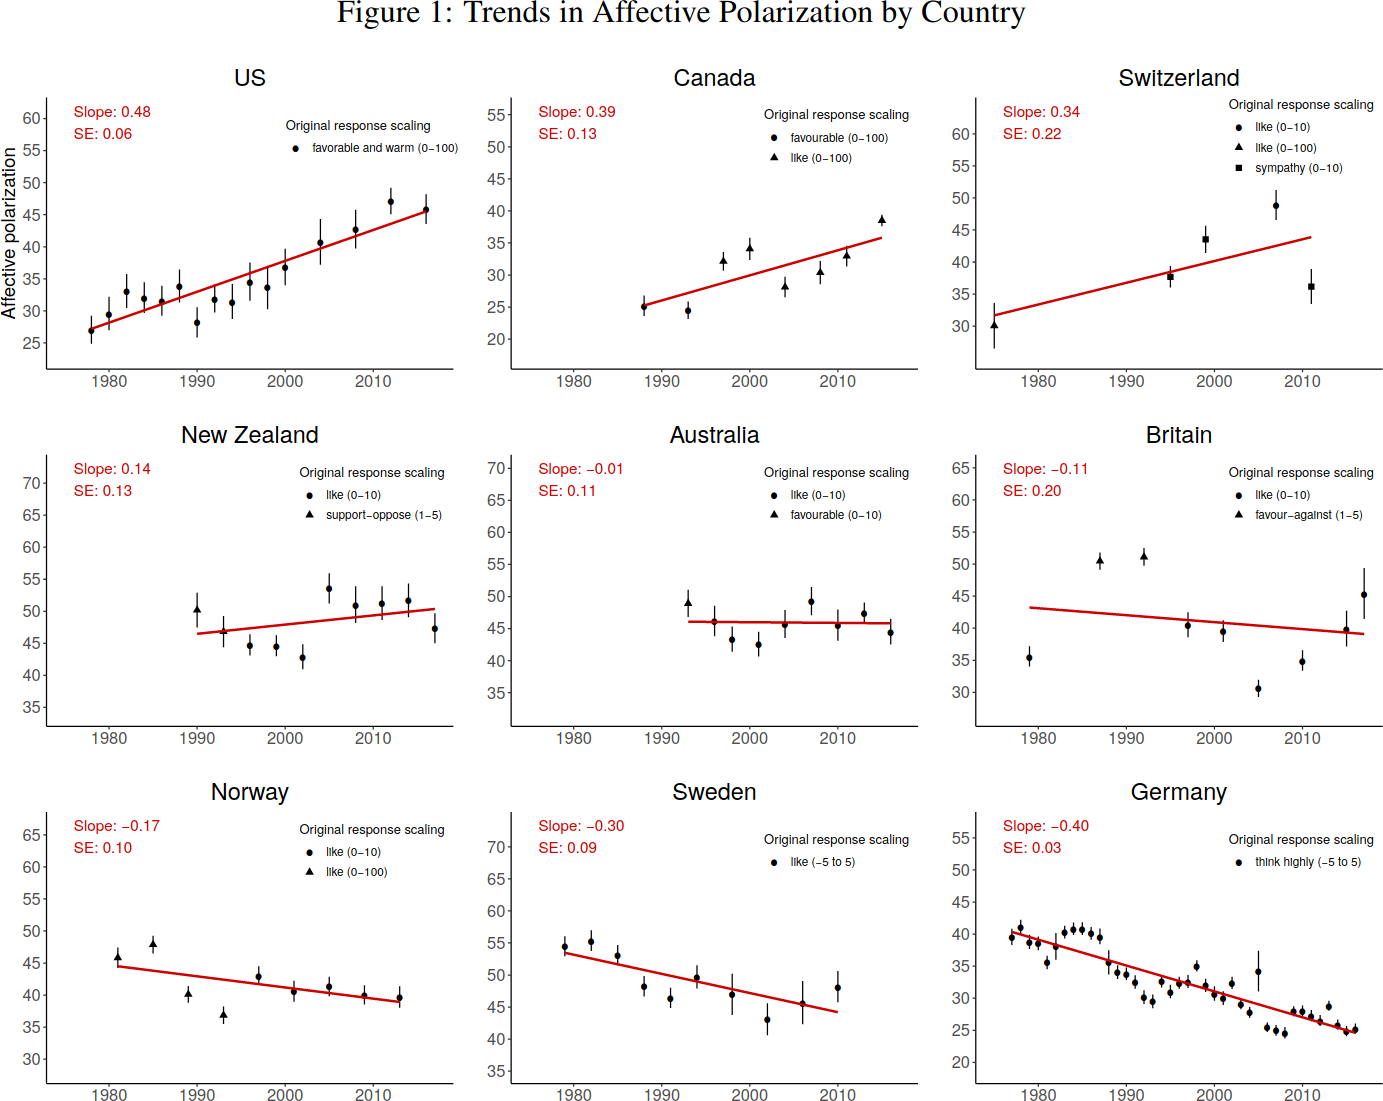
However, two European readers of this draft noted that for many-party systems, it is unclear that we can interpret polarization in the same way as for a two-party system. Thus perhaps we can only really meaningfully compare the US, UK, and Canada in the graph above (but then the UK is still a surprisingly non-polarized outlier, but perhaps Brexit and other recent developments show that this was itself temporary).
Acknowledging this caveat, US polarization itself seems well-explained by other trends. For instance, Boxell et al. (2017) find that polarization, averaged across 8 indicators, has increased steadily since 1980:
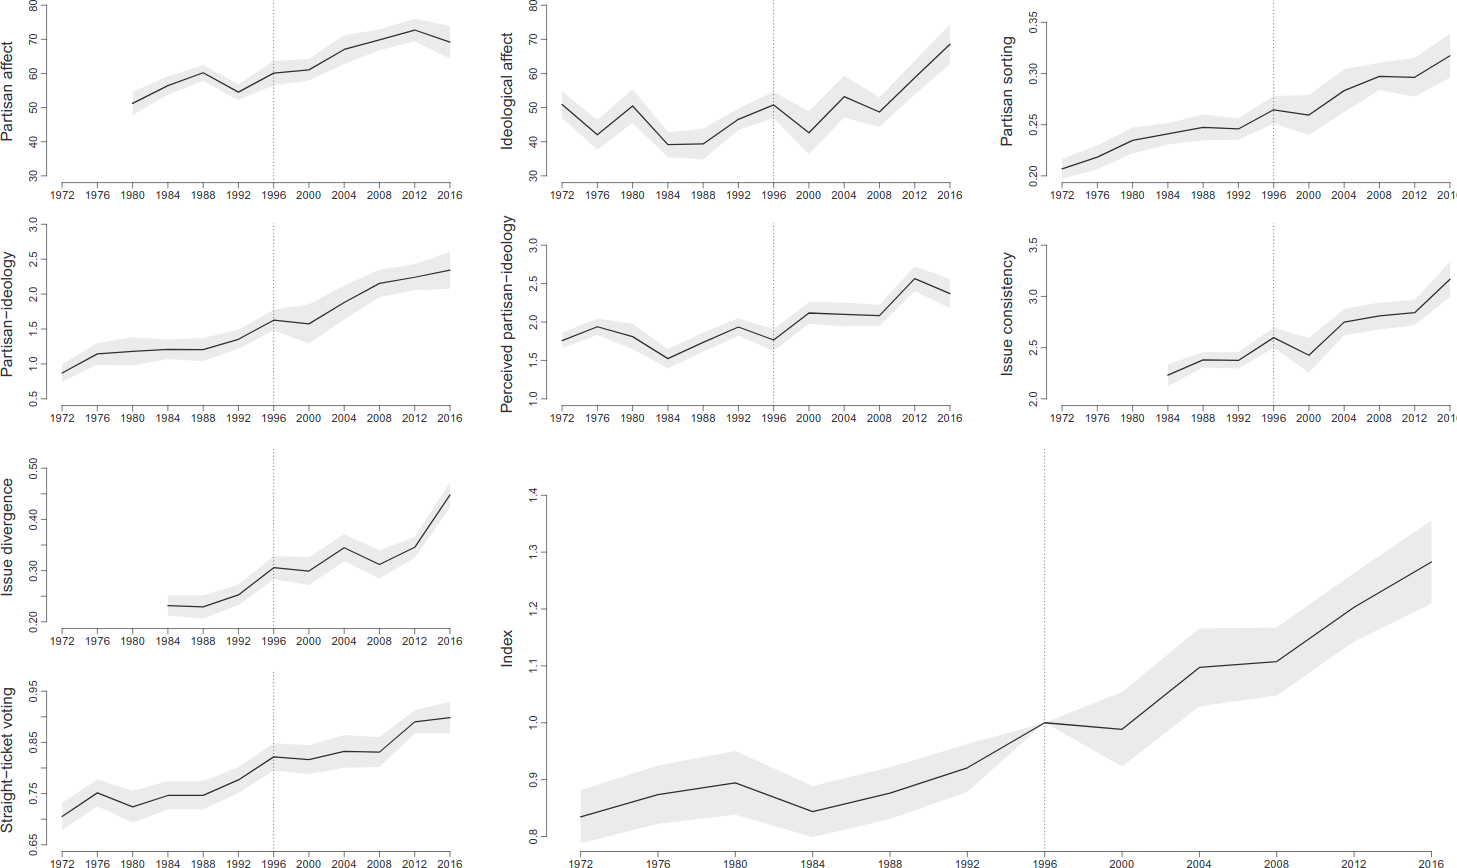
This trend in polarization seems better explained by the post-Civil Rights, post-suburbanization party realignment around 1970, in which the South flipped to being Republican and the Republican party itself focused more on identity and values politics. It’s not clear that we need social media as an additional explanatory variable for these trends, although if we squint at 2008-2016 we can see a (possibly spurious) uptick in the slope that could be compatible with social media accelerating the trend in polarization.
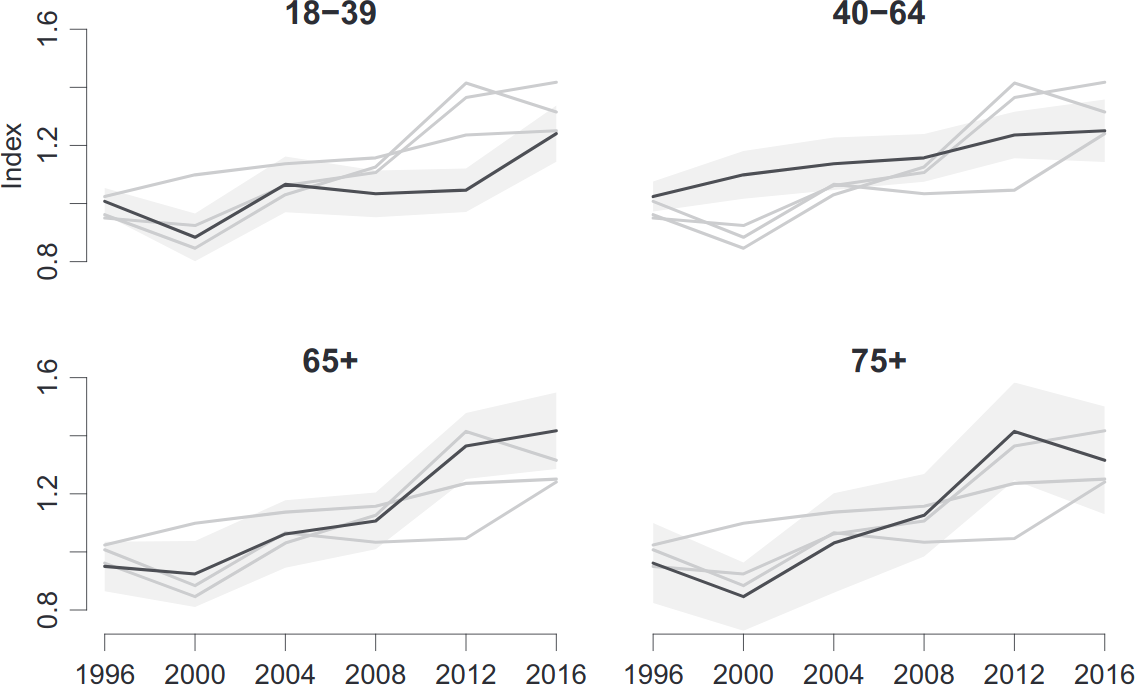
Another moderate piece of evidence against social media being the primary cause is that polarization has increased the most (from 1996 to 2016) in older age groups that use the internet less. Below are partisan affect and the overall index measured for each of several age groups (Diff is the difference between 65+ and 18-39):
| Measure | Overall | 18–39 | 40–64 | 65+ | Diff |
|---|---|---|---|---|---|
| Partisan affect | 9.1 (3.0) | 4.3 (4.9) | 8.9 (4.3) | 13.5 (7.7) | 9.27 (9.28) |
| Index | 0.28 (0.04) | 0.23 (0.06) | 0.23 (0.06) | 0.47 (0.08) | 0.23 (0.10) |
| Social media use | 90% | 65% | 33% | ||
| Population share | 38.2% | 40.5% | 21.3% |
The Partisan Affect and Index are from Table 1 of the Boxell paper, Social media use is from eyeballing Figure 2 of that paper, and the Population share came from eyeballing this graph.
Back-of-the-envelope calculations. If we assume all increase in polarization among 18-39 is from social media use, and weight the other age categories in accordance with this, then it explains (0.382 + 0.405 * 0.65/0.9 + 0.213 * 0.33/0.9) * 0.23 = 0.17 out of the 0.28 points, or 61%, which would be consistent with it being the major driver. On the other hand, this is too high because we should only attribute post-2008 increases to social media. Unfortunately, breaking out across age groups and only looking at an 8-year span yields data that are too noisy to easily interpret. I include this data below for completeness (ignore the grayed out lines):
One final caveat is that Pew finds less sharp differences in social media use across age groups.
Overall, I find the age-related data less convincing than the country-related data. It provides some evidence that social media is not the primary driver, but seems insufficient to obviously bound its effect or to test the acceleration hypothesis. Since the country-level data also has interpretation issues, I don’t think this completely rules out social media as a cause. However, I do think the strong historical increases pre-internet, as well as the general predominance of cable news, show that we would have a lot of polarization even without the internet or social media.
Are We Abnormally Online?
Most readers of this blog post consume significantly more news via the internet than does the average American. For instance, Figure 4 in this paper show that every age group (starting at 18-24 years olds) consumes more news via television than online. This is true for approximately zero of the people I know personally (except possibly my parents). As a result, I’ve relied less on my personal intuitions about social media polarization and more on statistical data.
Of course, it could be that social media drives polarization only among a small elite segment of highly educated Americans, but that this is nevertheless important because those Americans include most leaders in government, tech, and other important sectors. I place some weight on this being true (but think this would imply much different policy recommendations than those currently being discussed).
Could Social Media be an Accelerant?
If we draw a linear trend through the overall polarization time series in the U.S., we see that the increase since 2008 has been above trend:
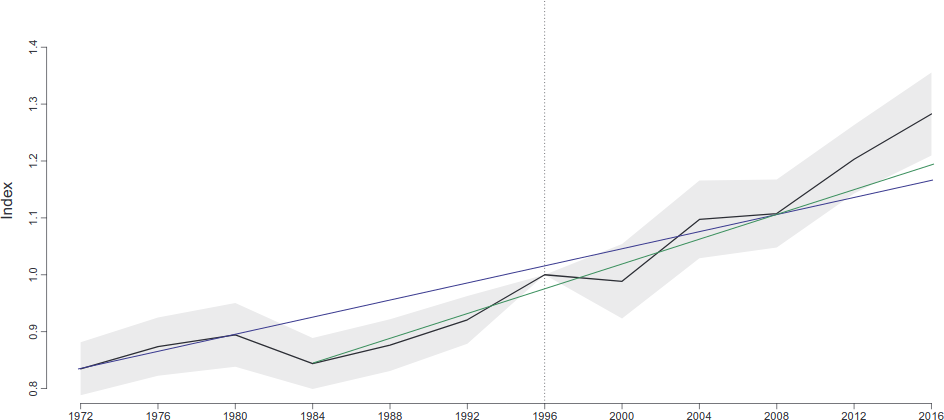
With the most generous choice of start and end points (1972 and 2008), it looks like the polarization increase from 2008 and 2016 might even be 5x what would be predicted under the trend! However, it’s difficult to tell this apart from noise, and you can get pretty different results based on where you start the line from (although for all that I checked, 2016 is substantially above trend). This looks like weak positive evidence for the acceleration hypothesis to me.
Conclusion
My overall best guess is that most polarization in the U.S. starting from 1970 has come from sources other than social media, and that TV news in particular is a strong driver. However, there is some evidence of a particularly sharp increase in polarization starting in the 2010s, which I give a ~50% chance to being driven (indirectly) by social media. If social media is a major indirect driver, I guess that it is either because it changes incentives for traditional media (~30%) or because it affects elite attitudes, which then percolate (~20%).
To better understand this, we would need to better understand the incentives created by social media. This is difficult, primarily because it is difficult to measure: you would need micro-level data on the the ideological slant or affect of news articles, which is difficult to collect at scale. Some awesome political scientists and economists are currently doing this, and our lab is helping them to build NLP models to help measure slant. I’m excited to share the results of this once we have them!
Thanks to Luca Braghieri and Markus Mobius for providing feedback on this post.